Prob_AI Hub Workshop Manchester
Do Deep Ensembles Capture Uncertainty
in Graph Neural Networks?
Viacheslav (Slava) Borovitskiy
https://vab.im

Do deep ensembles capture uncertainty in graph neural networks?
Summary and future work
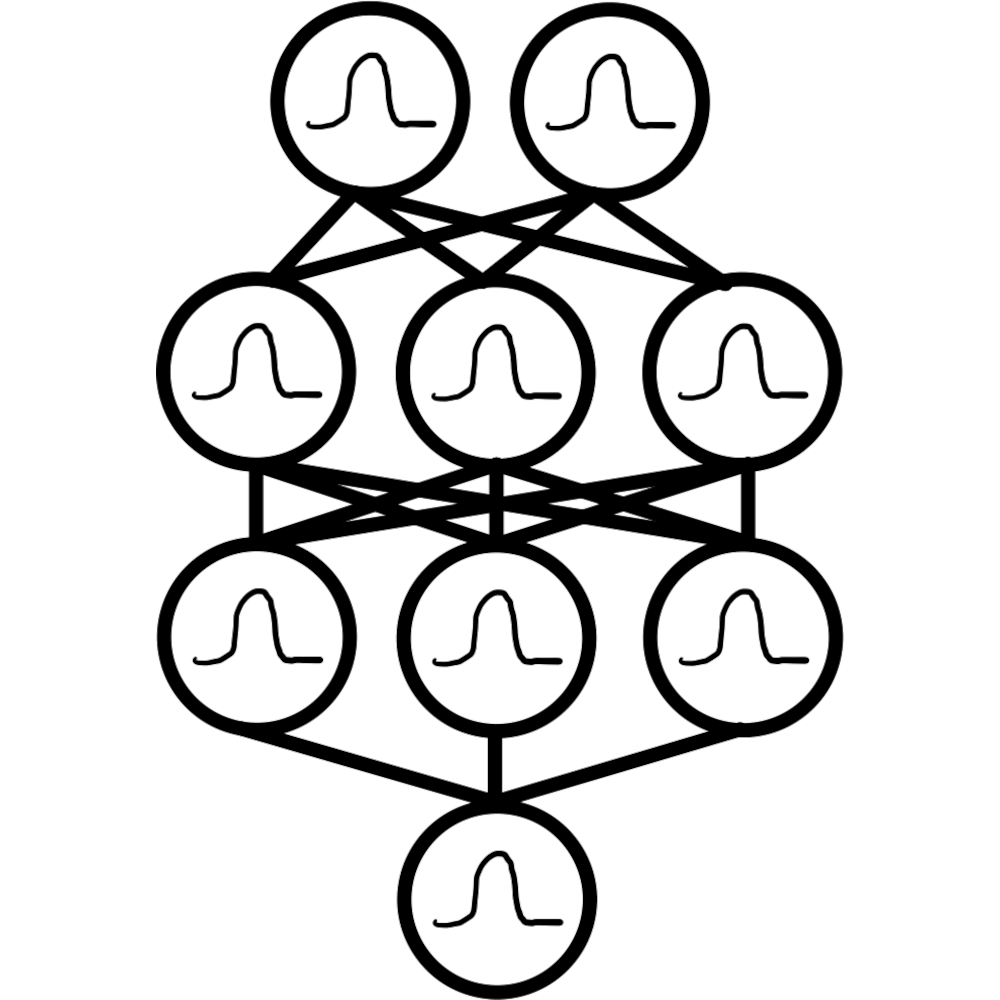
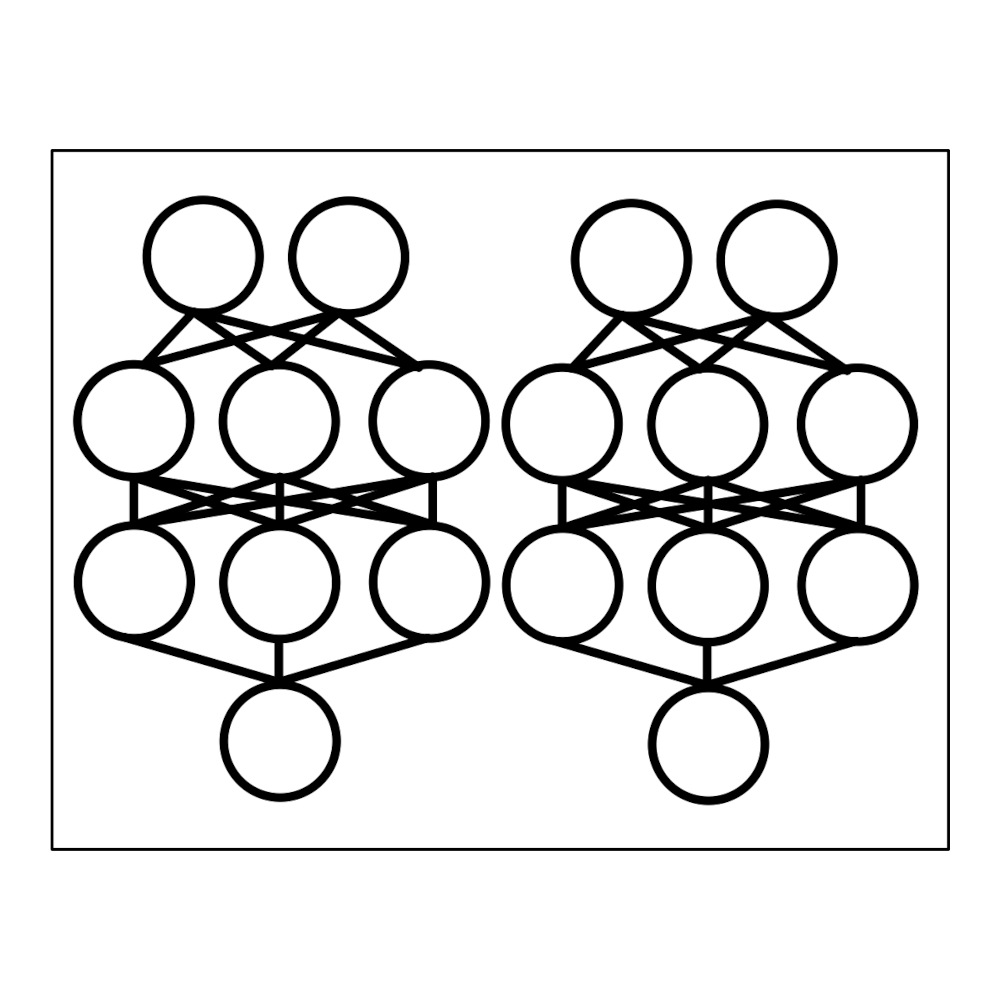
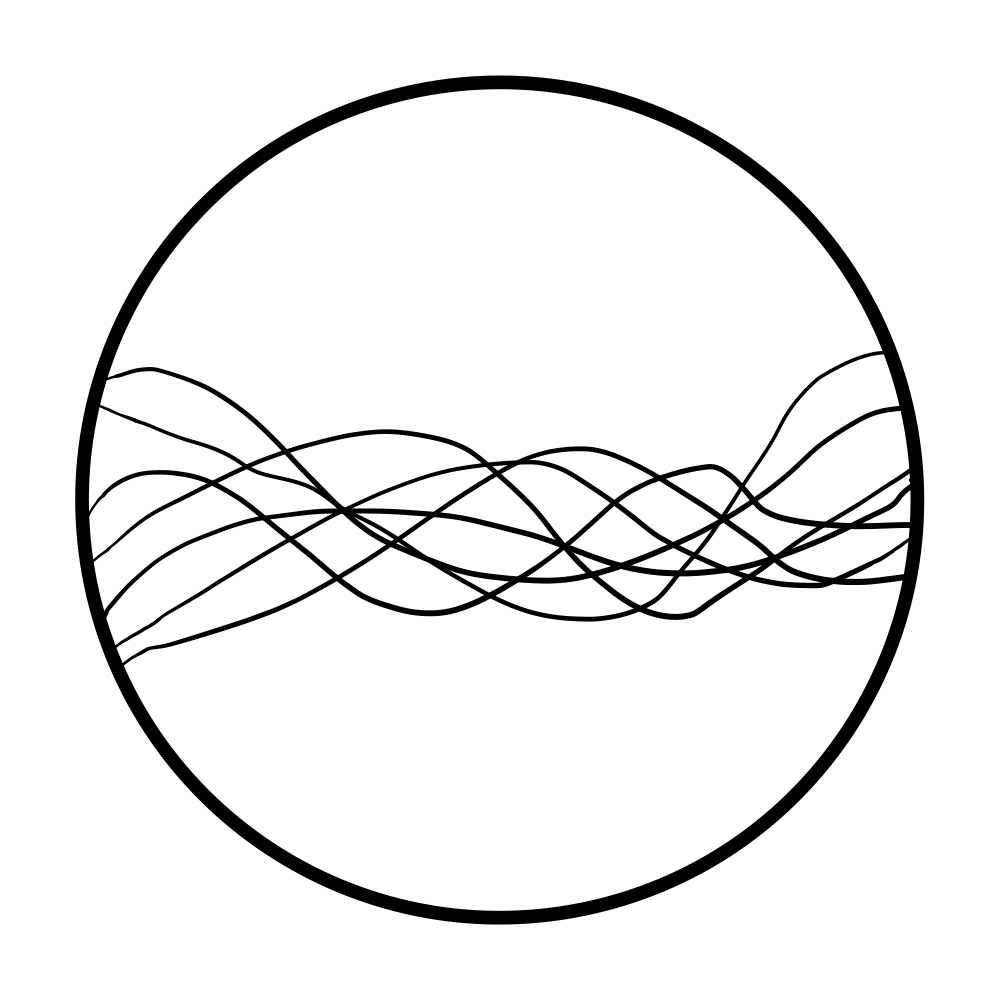
Includes many different settings.
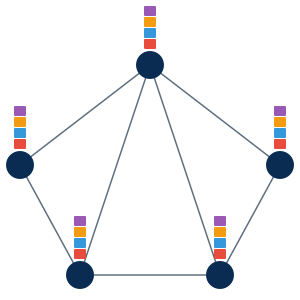
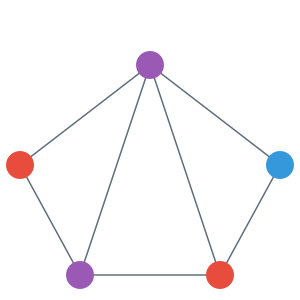
Also: edge-level tasks, graph generation, etc.
$$ f : V \to \R $$
$$ f\Big(\smash{\includegraphics[height=2.75em,width=1.5em]{figures/g1.svg}}\Big) = 2 $$
$$ f\Big(\smash{\includegraphics[height=2.75em,width=1.5em]{figures/g2.svg}}\Big) = 3 $$
$$ f\Big(\smash{\includegraphics[height=2.75em,width=1.5em]{figures/g3.svg}}\Big) = 5 $$
$$ f : V \to \text{distributions over } \R $$
$$ f\Big(\smash{\includegraphics[height=2.75em,width=1.5em]{figures/g1.svg}}\Big) = \f{N}(2, 0.5^2) $$
$$ f\Big(\smash{\includegraphics[height=2.75em,width=1.5em]{figures/g2.svg}}\Big) = \f{N}(3, 0.2^2) $$
$$ f\Big(\smash{\includegraphics[height=2.75em,width=1.5em]{figures/g3.svg}}\Big) = \f{N}(5, 0.7^2) $$
Each node is updated from its own features and those of its neighbors.
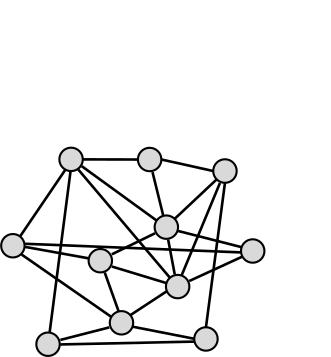
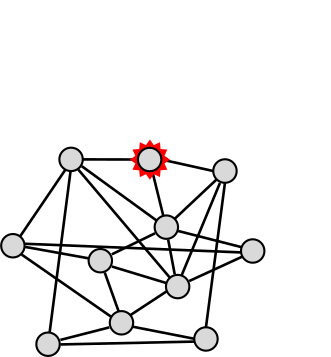
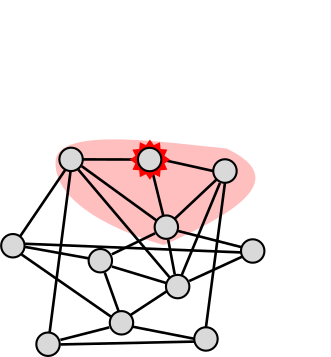
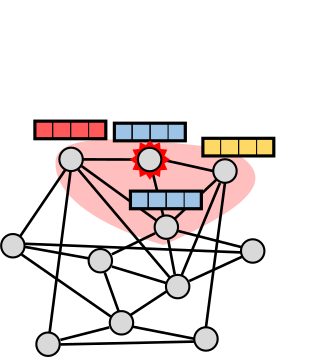
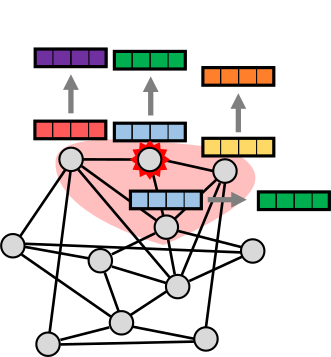
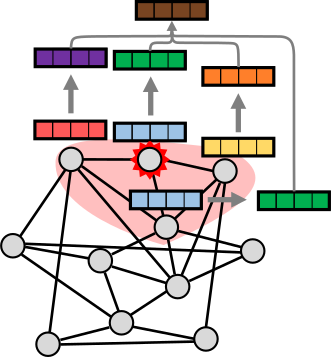
Example: Graph convolutional network (GCN): $$ \v{x}_i' = \frac{1}{1 + \abs{\c{N}(i)}} \sum_{j \in \c{N}(i) \cup \cbr{i}} \f{MLP}\del{\v{x}_j} $$
San Jose highway network: graph with 1016 nodes
325 labeled nodes with known traffic speed in miles per hour
Use 250 labeled nodes for training data and 75 for test data
Dataset details: Borovitskiy et al. (AISTATS 2021)
Figure: Uncertainty estimates of a geometric Gaussian process.
PeMS benchmark: GNN ensemble fails miserably w.r.t. NLL.
Is the failure on PeMS an isolated anomaly?
Or is it symptomatic of a broader incompatibility
between deep ensembles and graph neural networks?
We investigated this for message passing graph neural networks.
(GCN, GAT, etc.)
Evaluating across diverse tasks, scales, and structural properties.
Node Classification
Node Regression
Graph Regression
Main metric: held-out negative log-likelihood, a strictly proper scoring rule.
How much more likelihood does the ensemble assign to test data?
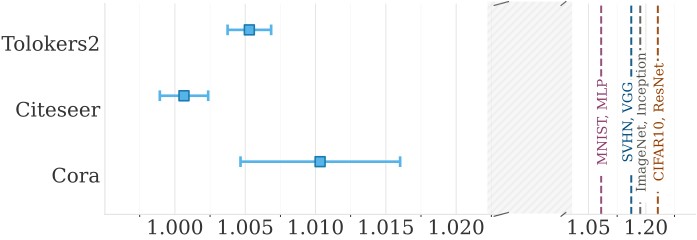
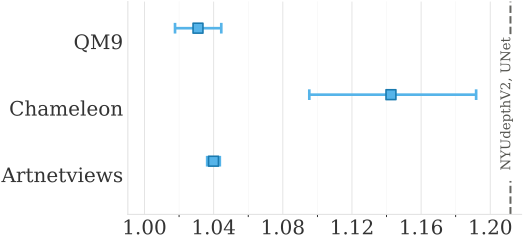
Computer Vision
Typical improvements: ~20%
Graph Neural Networks
Improvements: often as low as 0.1%
The gains exist, but they are surprisingly marginal. Why?
Do deep ensembles improve uncertainty, or just point predictions?
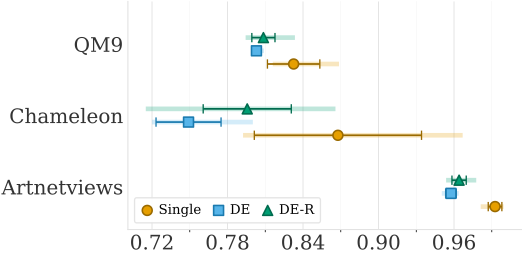
NLL
Conclusion: Ensembling on graphs acts primarily as a variance-reducing smoother for point predictions, not a better uncertainty estimator.
$$ \underbrace{\f{Var}\sbr{y \given x}}_{\text{total}} \;=\; \underbrace{\frac{1}{M}\sum_{m=1}^{M} \sigma_m^2(x)}_{\text{aleatoric}} \;+\; \underbrace{\frac{1}{M}\sum_{m=1}^{M} \del{\mu_m(x) - \bar{\mu}(x)}^2}_{\text{epistemic}} $$
Classification: similar, with entropy.
Aleatoric
Already reported by each member;
the ensemble merely averages it.
Epistemic
Visible only across members:
it is exactly their disagreement.
If individual models in an ensemble do not disagree,
they cannot capture epistemic uncertainty.
Let's decompose the uncertainty of our GNN ensembles.
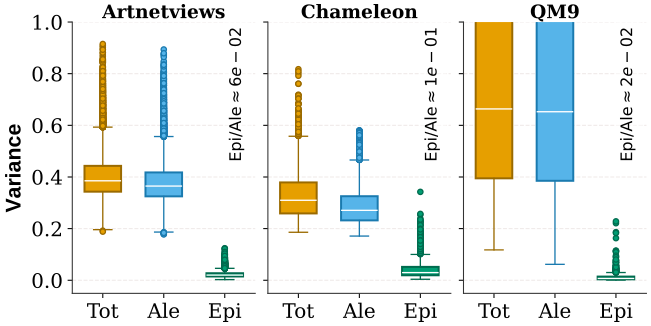
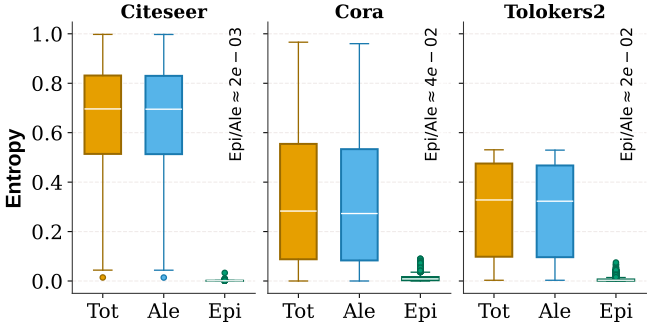
GNNs consistently converge to highly similar predictions.
Epistemic uncertainty collapses to near-zero.
Because they do not meaningfully disagree, they neutralize the very mechanism that makes deep ensembles work (for uncertainty quantification).
Deep ensembles rely on a highly non-convex loss to find diverse solutions.
Weight space: Non-convex
Averaging weights degrades performance dramatically. Thus individual models live in different regions of the weight space.
Function space: Convex-like
Despite having completely different weights, individual models all implement virtually the same predictive function.
Inductive bias of message passing is a homogenizing force
restricting functional diversity.
Key Takeaways
Future Directions

Main metric: held-out negative log-likelihood, a strictly proper scoring rule.
$$ \mathrm{NLL} = \frac{1}{n} \sum_{i=1}^{n} \Bigl( \underbrace{\frac{\del{y_i - \mu_i}^2}{2 \sigma_i^2}}_{\text{standardized error}} \;+\; \underbrace{\log \sigma_i \vphantom{\frac{\del{y_i - \mu_i}^2}{2 \sigma_i^2}}}_{\text{sharpness}} \Bigr) + \mathrm{const} $$
Neither term is accuracy alone, nor calibration alone.
We also track RMSE / accuracy and miscalibration area / ECE (in the paper)